Applies to: WebinarJam and EverWebinar
Use analytics to understand how your webinar is performing, from registration and attendance to engagement and revenue.
Access analytics
To view analytics for your webinar:
- Open WebinarJam or EverWebinar
- Click Analytics in the left-side menu
- Select a Webinar, Session, and Event from the dropdown fields
Traffic
Traffic analytics show how people move from registration to attendance.

You can view:
- Total visitors to your registration page (WebinarJam-hosted or custom)
- Sign-up rate (percentage of visitors who registered)
- Total number of registrants
- Number of registrants who attended the live session
- Number of registrants who attended the replay
- Show-up rate (percentage of registrants who attended)
- The number of registrants may be higher than the number of visitors if users are added through:
- If double opt-in is enabled for the webinar, the user will be counted as a registrant only after they confirm their subscription through the double opt-in confirmation email. Learn more about the double opt-in process.
Pro tip
Hover over the traffic graph to see data by device type (computer, phone, tablet, or unknown).
Split tests
Split test analytics compare performance between two versions of your registration page.

You can view:
- Visitors for each version (A and B)
- Sign-up rate for each version
- Total registrants from each version
The version with the higher sign-up rate is generally considered the winner.
- Split testing must be enabled in your webinar settings
- External registration pages cannot be tracked for split tests
Engagement
Engagement analytics measure how attendees interact with your webinar. Live and replay data are shown separately.

You can view:
- Total number of attendees
- Total webinar duration
- Average watch time per attendee
- Percentage of attendees who watched the full webinar
- Average user rating and number of ratings
- Attendee activity graph (shown at 5-minute intervals)
Monetization
Monetization analytics track revenue generated from your webinar.
Registration revenue (if applicable)
- Number of paid registrations (tickets)
- Total revenue from registration fees
Sales from the live webinar
- Number of purchases made during the live session
- Total revenue generated
- Conversion rate (percentage of attendees who purchased)
- Earnings per attendee
Sales from the replay
- Number of purchases made from the replay
- Total revenue generated
- Conversion rate
- Earnings per attendee
Conversion rates only include attendees who entered the room. Registrants who did not attend are excluded.
Pro tip
Revenue tracking may require additional setup. Learn more:
Notifications
Notification analytics track the performance of your webinar emails.
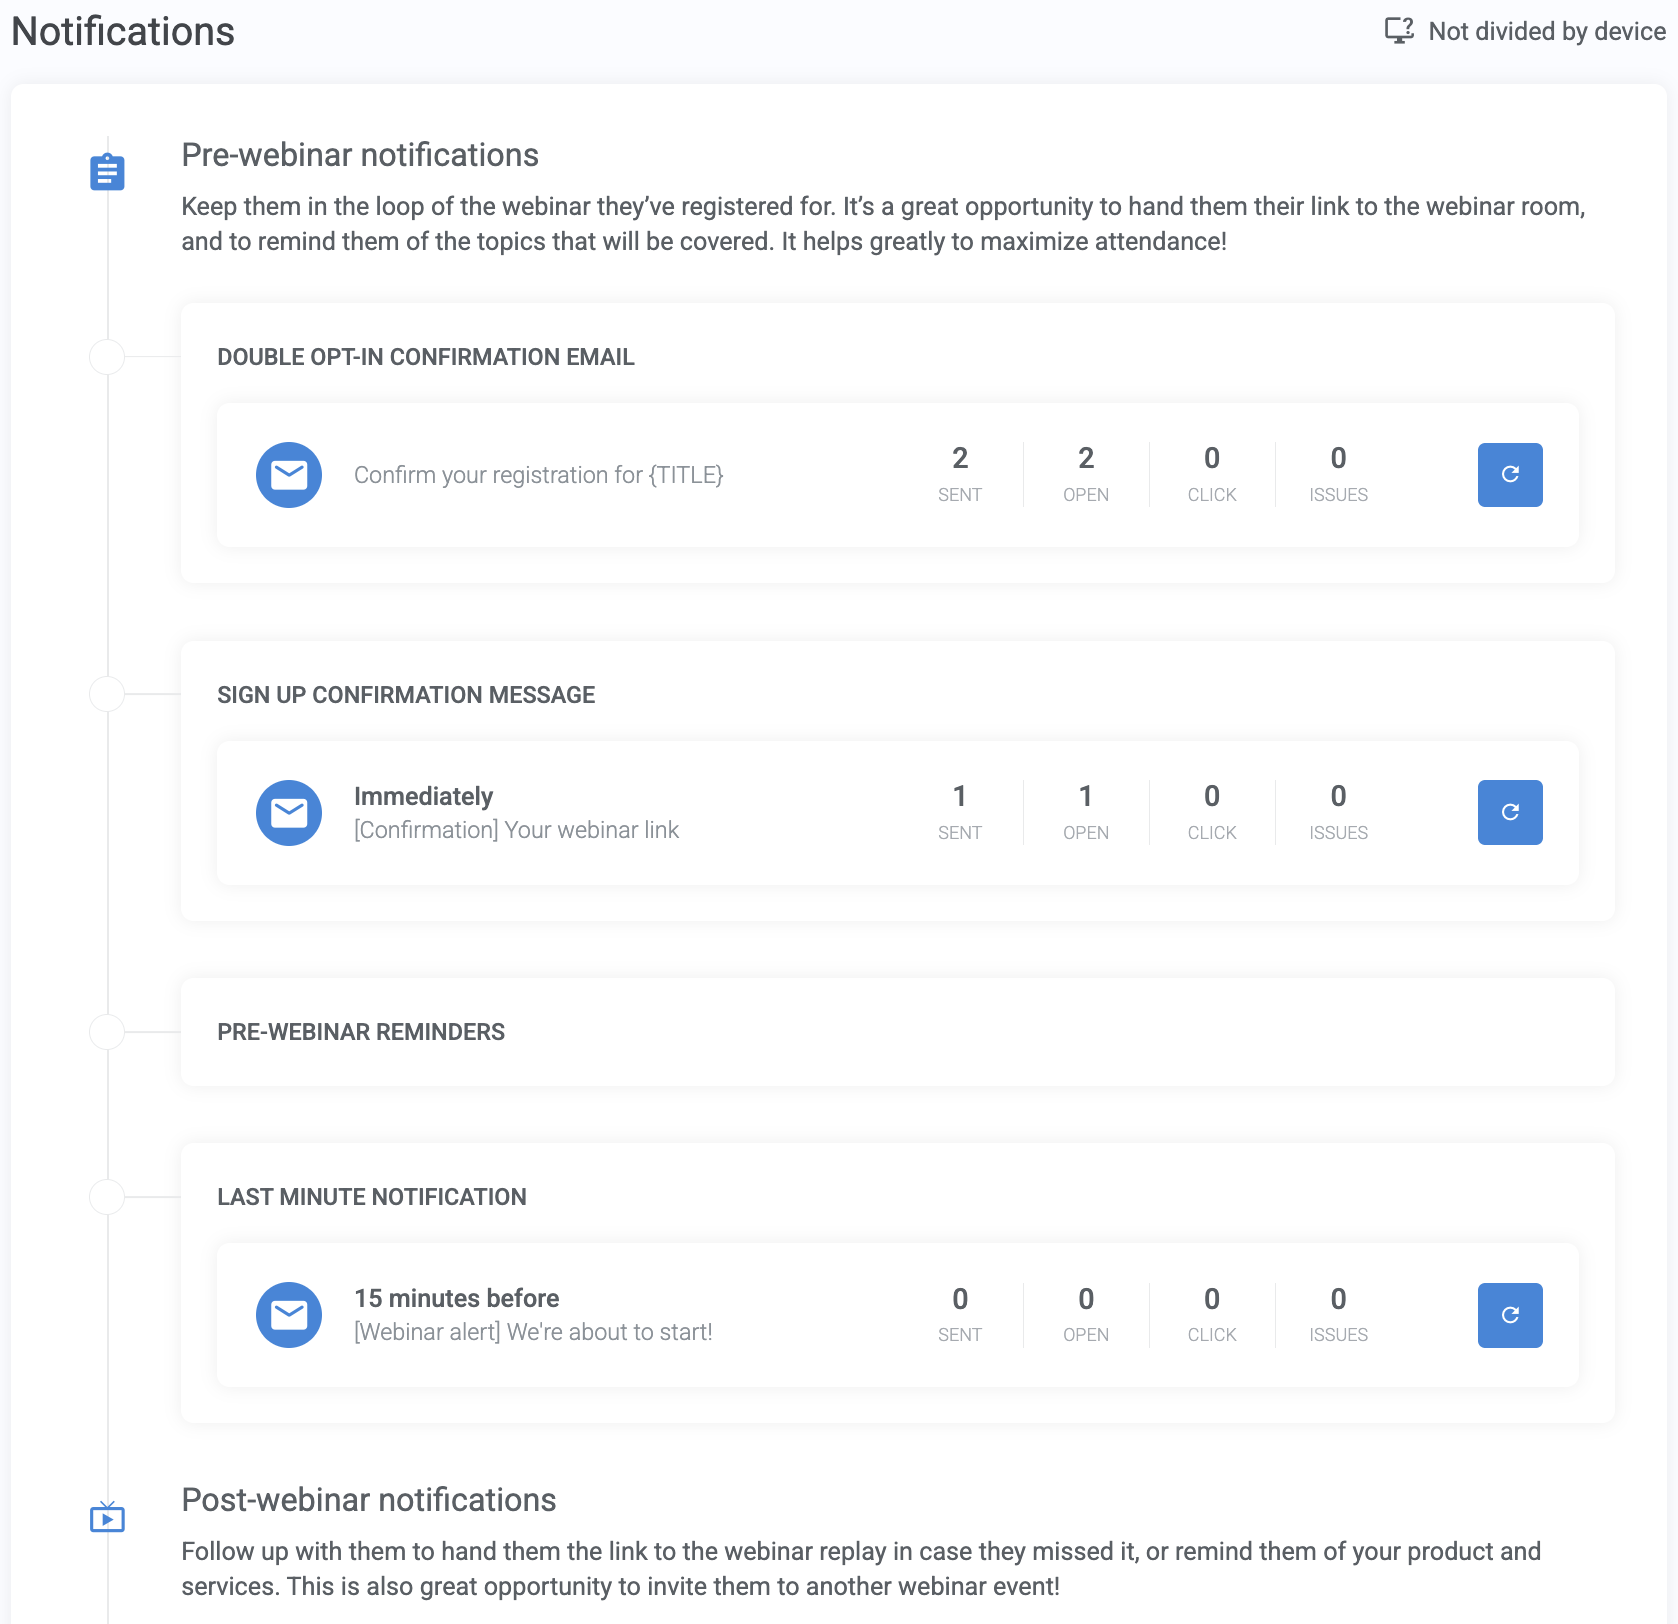
You can:
- See the number of emails sent
- View the open rate (how many recipients opened the email)
- Compare it to the click rate (how many times links were clicked)
- Review the number of issues (understand why certain registrants did not get an email)
- Blacklisted email address
- Deleted lead
- Cancelled subscription
- GDPR not accepted
- Not attended but notification is sent to those who attended
- Attended but notification is sent to those who did not attend
- Did not make a purchase but sent to those who did + vice-versa
- Left before/stayed until configured notification time
- SMS/call notification but the lead is missing their phone number
- Reset all email statistics
- Important: This action cannot be undone.
Export Analytics
You can export your analytics data for reporting or further analysis.
To export:
- Select the desired Webinar, Session, and Event filters
- To export all sessions, select All Sessions
- To export all data, select All Time
- Click Export in the top-right corner
- In the pop-up window, select Export the currently selected filters
- Click Export

